Who Signed Up for the Do-Not-Call List?1

Hal Varian
UC Berkeley, SIMS, Fredrik Wallenberg
UC Berkeley, SIMS, Glenn Woroch
UC Berkeley, Econ

"The makers of our Constitution ... sought to protect Americans in their beliefs, their thoughts, their emotions and their sensations. They conferred as against the Government, the right to be let alone-the most comprehensive of the rights of man and the right most valued by civilized men."
-U.S. Supreme Court Justice Louis D. Brandeis.

1  Introduction

Technology has made it increasing difficult to be "let alone" as the number of portals into homes and businesses continues to grow, and as access to those portals remains relatively easy. Fixed and mobile phones, fax machines, voice mail, email and instant messaging all represent opportunities for commercial interests to solicit consumers and invade their personal privacy in the process. This paper attempts to identify determinants of the value that individuals place on their privacy-that Constitutional right exalted by Justice Brandeis in his 1928 dissenting opinion in Olmstead v. United States.
Legal scholars have identified several facets of personal privacy.2 We focus on individuals' desire for "solitude" generally, and more specifically, their desire not to be interrupted by telemarketing calls and other unwanted phone solicitations. We treat actions taken by households to protect their privacy as expressions of the value they attach to their solitude. This occurs when households subscribe to a calling feature on a phone line and use it to block or screen incoming calls. Clear evidence of demand for privacy occurs when individuals register their phone number on a do-not-call (DNC) program which are then removed from telemarketers' calling lists.
We exploit a natural experiment conducted by the Federal Trade Commission when it began to collect phone numbers for a national do-not-call registry last year. That program registers landline and cellular phone numbers and penalizes all non-exempt telemarketers for calling them. The FTC list has been a big hit: more than 60 million phone numbers have been registered since it first began.
What causes people to register their phone numbers with the DNC list? We discover some answers to this question by merging the collection of registered phone numbers with household demographic information. We are especially interested in the relationship between sign-ups to the DNC list and household income, composition, race and education when making this decision. We also attempt to use the pattern of DNC sign-ups to quantify:
We begin our analysis by constructing a choice model of household demand for privacy protection. Because households' evaluation of registration on a do-not-call list depends on the likelihood and frequency of telemarketing calls they receive, we also build a simple model of telemarketer calling behavior. In the end, sign-up is a product of both household privacy tastes and endowments and telemarketers' calling patterns. Since some demographic factors will affect both decisions, they will be confounded in our empirical results. Further, due to the fact that DNC sign-ups cannot be matched with households, we must sum up these individual decisions to some aggregate regional level. While our formal analysis of consumer decision making does not generate a econometric specification directly, it guides our specification of the econometric models.
The empirical analysis begins by segmenting the phone numbers registered to the FTC list by county and then matching them to county-level demographics from the Census and other datasets. We then regress sign-up frequencies on demographic variables. Next, we estimate grouped logit models of sign-up frequencies on various combinations of demographic variables and other factors.
Many of the variables that appear significant in these specification have a natural interpretation, as do the signs on their coefficients. For instance, higher sign-ups occur in counties with higher household income and higher educational attainment. We can also explain the strong relationships between sign-ups and the percentages of households that have a mortgage and that are "linguistically isolated." However, there are some surprises, as in the case of Internet penetration rates which appear to be negatively, if weakly, related to sign-up frequencies. The effect of age of head of household is uneven: young households have low participation in the DNC program, senior citizens have high participation, and in between the effect varies in sign and significance.
We use some of our estimation results for DNC sign-ups to make crude predictions about the popularity of a do-not-spam list, if one were created that resembled the DNC programs. Our predictions are based on the lack of correlation we found between DNC sign-up behavior and household Internet access. Finally, we offer some estimates of the monetary value to consumers of do-not-call programs.

2  Background

Both state and federal legislation has been enacted that enable consumers to block unsolicited telemarketing calls. The Telephone Consumer Protection Act (TCPA) of 1991 established consumers' federal rights with respect to telemarketing calls. Last year, the Federal Communications Commission created a national registry when, in coordination with the FTC, it amended its rules implementing the TCPA..3
The national DNC program collects phone numbers that are removed from telemarketers' calling lists. Consumers add their phone numbers either by making a toll-free phone call or by visiting the FTC's website. If the phone is used, a consumer must call from the number that is being registered, and only one number can be registered at a time. If, alternatively, the consumer signs up on the web, up to three phone numbers can be added at one time, though it requires an active email account (besides Internet access).4 Consumers have the option to later remove a number from the registry. Only residential lines are allowed on the list but both landline phones and cell phone numbers can be registered.5
The FTC began to accept phone numbers on June 27, 2003. Unintentionally the agency implemented an experimental design when, for the first 10 days of the program, consumers living east of the Mississippi (not including Minnesota and Louisiana) were not able to sign up by phone while westerners could sign-up by Internet as well as by phone.6
All telemarketers are required to "scrub" their calling lists of phone numbers on the DNC list on a set schedule.7 The national do-not-call applies to both interstate and intrastate telemarketing calls. A telemarketer who continued to call registered numbers could face fines up to $11,000. Exceptions were granted for three classes of callers: those protected by free speech (political campaigning, survey research), nonprofits and charities, and companies having a recent commercial relationship with the consumer.
The FTC registry is not the only, or the first, do-not-call list. When it was launched, no fewer than 29 states had maintained some arrangements for registering phone numbers of their residents. Of these, 15 states eventually decided to merge their lists with the FTC's. Consumers who registered with a state program that was merged did not also have to sign up a second time. States that declined to merge their list with the national list often continued to run their registries in parallel.8 Interestingly, whereas the FTC DNC is free to consumers, several states charge their residents to join their list-usually a one-time fee that while small, often requires an annual renewal fee.
Independently, the Direct Marketing Association (DMA) collects consumers' phone numbers for its "Telephone Preference Service" (TPS).9 Members of the DMA are "required" to adhere to the TPS requests, but it is unclear how effective is the enforcement and what penalties are imposed for violations. Compliance with the TPS is voluntary for non-members. According to the DMA, the TPS was "80.5 percent effective at decreasing the number of telephone solicitations."10 Prior to the advent of the national DNC list, the DMA claims that approximately 7.5 million individuals were registered on the TPS.
Consumers can protect against unwanted calls using other means besides joining a do-not-call registry. They can subscribe to calling features offered by their local telephone companies-such as caller ID or call blocking-that enable the called party to refuse unidentified or suspicious incoming calls. Even a simple answering machine can perform some of these functions as when the consumer screens calls.11 The ability to selectively choose which callers are able to reach the consumer, and which calls are accepted, give these calling features an advantage over a do-not-call list. DNC programs are rather blunt means to protect consumers as they indiscriminately excludes large blocks of telemarketing calls.12

3  Model of Demand for Privacy

We apply standard consumer theory to describe a household's decision to protect its privacy-such as signing up with a do-not-call list or subscribing to a privacy calling feature. In this view, when a solicitation occurs, it likely causes some disutility for the consumer. Individuals vary in their preferences for privacy in ways that are both observable and unobservable. While not common, it is happens that consumers wish to make a transaction with the telemarketer or at least to be informed of their offering. In addition, consumers are "endowed" with different baseline levels of privacy as a consequence of their immediate environment, affecting the marginal value they attach to blocking telemarketing calls or other invasions of privacy.
Additionally, households can choose when to register their phone numbers if they decide to do so. We believe that consumers express greater demand for privacy when they sign up early than those who register later, though we do not explicitly model the timing decision. We do make use of the timing of registrations on occasion, however.
When deciding whether to register, a household takes into account the expected benefits that follows from having its number blocked from telemarketers, and weighs it against any cost of registering and having the number blocked. If a number is not registered, then with some probability it would be called. That probability depends on the average likelihood and frequency with which telemarketers call a particular line which, in turn, depends partly on the characteristics of the household that owns that line.13
Even if a call is placed to a line, there may not be someone present to answer. The greater the number of household members, all else equal, the greater the likelihood telemarketers will reach some person in the household. 14 It is before this point, however, when privacy calling features can intercept or divert an incoming call. Assuming the call reaches a live person, they can still reject the call, though it causes some nuisance by that point. And it is entirely possible that the consumer would want to do business with the telemarketer, in which case the call would offer positive benefits.
If the household registers its phone number(s) on the DNC list, the only calls that should get through would be from callers who are exempted under the rules. If an exempt call came through, it would again depend on whether someone was available to answer it, and if so, whether the solicitation was welcomed or merely an annoyance.
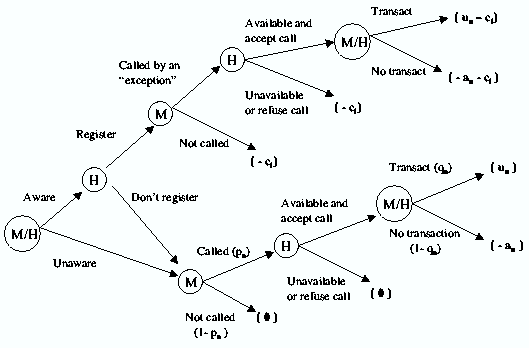
We can represent the household's problem by a decision tree with a series of binary branches governed by either a decision by the consumer or telemarketers, or by a chance event (see Figure 1). Associated with each final branch of the tree is a payoff to the household. We presume that a household's expected utility from alternative events will guide its decision to register with a DNC list.
Figure 1: Household decision tree for DNC sign-ups
graphics/DecisionTree.png
As shown in the decision tree, a pre-condition for a household to join the DNC list is that it be aware of the program's existence and effectiveness. Awareness of the FTC's do-not-call registry varies over time with press coverage and competing and complementary events (e.g., each legal challenge to the FTC list). We also expect variation in awareness across region if only because state programs might raise residents familiarity with the concept of a do-not-call registry.
Each element of the tree contributes to a household's expected utility, and hence, explains the signup frequencies we observe. To illustrate, consider some factors that bear on a few of these elements. The more difficult and costly it is to signup for a DNC list, the less likely we would expect an average household to do so. Some state DNC programs charge residents for placing their phone numbers on their lists, raising the value of the signup cost cn. See Table in Appendix A. Many, but not all, state lists allow households to register by the Internet, and for those households with access to the Internet at home or work, the cost of signing up, on average, will be lower than for those without access.
Telemarketers are also part of this equation especially with regard to the likelihood and the frequency with which they call a phone number. This calling pattern is captured here by pn. At least in part, these probabilities reflect the telemarketing community's assessment of the desirability of certain households, which means the likelihood they will complete a profitable transaction. Telemarketers also have some control over the extent of the annoyance they cause when their solicitation is unwanted, an.

3.1  Random Utility Model of Do-Not-Call Registration

We adopt a random utility approach to model decisions to register with a do-not-call list. Individual choices can then, in principle, be summed to the same level of aggregation as the available demographic data.
The first issue that must be addressed is to identify the relevant decision maker. One candidate is the household since its members may make a single decision whether to register its various lines, each of which contribute to the invasion of members' collective privacy. Alternatively, adult persons could make registration decisions on a line by line basis. This might make sense for cellular phone lines that are rarely shared by multiple individuals. Since we will eventually exclude cell lines from the empirical analysis for various reasons, we feel justified in taking the household as the decision maker.
Taking a simplified view of the household decision problem in the previous section, if household n registers its line(s) with the do-not-call list, the realized utility will be:
u1n=vn(yn-ci,zn)+e1n
(1)
where vn(yn,zn) is deterministic utility associated with household income yn and demographic characteristics zn (e.g., race, education) and where ci represents the monetary equivalent of out-of-pocket and intangible costs of signup in region i.
When the household does not register, it believes that it will be called with probability pn, in which case its expected utility will be:
u0n
=
pn[ vn(yn,zn)-an] +(1-pn)vn(yn,zn)+e0n
=
vn(yn,zn)-pnan+e0n
(2)
As before an is the disutility of a telemarketing call specific to household n . Household n will register when u1n > u0n, or equivalently, when
vn(yn-ci,zn)+e1n
>
vn(yn,zn)-pnan+e0n
e1n-e0n
>
[ vn(yn,zn)-vn(yn-ci,zn)]-pnan
(3)
Let F(·) be the c.d.f. of the difference between the two disturbances. Then the likelihood of registration is:
fn=1-F[ vn(yn,zn)-vn(yn-ci,zn)-pnan]
If we were to assume that the deterministic part of household utility is linear in the variables,i.e., vn(yn,zn)=b0+byyn+bzzn, then the term in the distribution function simplifies to just byci-pnan where by is the marginal utility of income. Simple comparative static exercises confirm that signup frequency is decreasing in cost of signing up and increasing in the magnitude of the annoyance: [(fn)/(ci)]=-fby < 0 and [(fn)/(an)]=fpn > 0.

3.2  Telemarketers' Calling Behavior

Telemarketers are presumed to follow systematic rules for calling potential customers even if that involves some randomization. We assume these rules are optimal-just as in the case of households' decisions to register with a DNC\ list. In its simplest form, if the telemarketer makes a call to household n, it will either succeed or fail to generate a transaction. Let the chance of success be qn for household n given the call goes through. This conditional probability depends on characteristics of the household among other factors. Telemarketers would prefer to only call those lines that resulted in profitable transactions, but they must rely on noisy signals.15 If the telemarketer meets with success, it realizes a profit of tn.
Consider the problem facing a representative telemarketer. Expected profitability of calling household n is dependent on the likelihood of a successful transaction and the profitability of a transaction if one occurs:
pn
=
qn(tn-c)+(1-qn)(-c)+nn
(4)
=
qntn-c+nn
The error term, nn, captures the cost to the telemarketer of calling the household, plus any randomness in the household's willingness to transact or any randomness in selection of a target (e.g., random number dialing). The cost of making a call c is assumed not to vary across households and is independent of whether the call is successful or not.
Conditional on the error term, the telemarketer (or its software package) decides to call household n when pn > 0. From the perspective of household n (and the researcher), however, a telemarketing call is a binary random variable with probability: pn=Pr{ pn > 0} Assuming households have rational expectations, this probability will enter random utility (2).
While consumer characteristics like income and demographics do not appear explicitly in the expression for telemarketer's call profitability, those variables enter indirectly through their influence on the likelihood of a transaction, qn, and the profitability of a transaction, tn. Looking ahead to empirical estimation, we should not presume an unambiguous relationship between DNC signup frequencies and demographic variables. Take household income. Higher income may raise the value of time, and thus the annoyance from unwanted telemarketing calls. It also may raise the expected profitability should a transaction occur. These two tendencies reinforce one another, increasing the value of registering with the DNC list. However, the likelihood of a transaction with higher income consumers could be lower than those with lower income, making a call to these lines less attractive to telemarketers, reversing the effect of income. We only observe the net effect of income (and other demographic variables) on DNC signup frequencies and are not yet able to instrument for these intervening factors.16

3.3  Geographic Aggregation of Signup Frequencies and Household Demographics

We cannot associate any registered phone number with a household, and consequently, we cannot estimate a household choice model explicitly. We can, however, associate fixed-line phone numbers with a geographic region. This is done using the relationship between a fixed line and the local exchange company's "wire center" and the geographic location of those wire centers.
As before, let n index households and define Ni as the set of households that are located in region i. Assume that a household registers all its (fixed) lines if it chooses to register any one of them. In that case, we can form the frequency of DNC signup in region i as:
fi=

å
n Î Ni 
lnfn


å
n Î Ni 
ln
where ln is the number of lines owned by household n. Averaging the explanatory variables takes a slightly different form; in the case of average household income in region i:17

y
 

i 
=

å
n Î Ni 
yn

#Ni
We choose to aggregate up all variables to the county level (specifically, the 5-digit FIPS code), reducing over 60 million phone numbers to about 3,100 observations.

4  Data

We have obtained redacted information on the more than 60 million phone numbers that were entered into the FTC's do-not-call registry between June 26, 2003 and November 1, 2003 (along with the time and date each number was registered). To ensure privacy, only the area code and exchange prefix of the number (the so-called "NPA-NXX," or more simply, "the exchange") was reported in the dataset and exchanges with 10 or fewer observations have been dropped from the analysis. The exchange level observations were then mapped to counties. Using a database provided purchased from the Mellisa Data Corporation one often used by telemarketing firms themselves we mapped the exchange into the county.
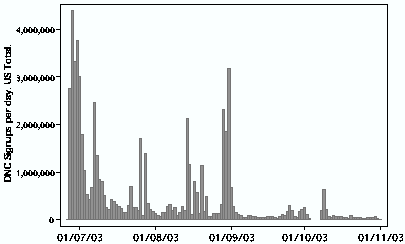
Figure 2: DNC sign-ups over time
graphics/dncdates.png
Figure 2 plots the number of phone numbers added to the national registry in each of the 129 days for which we have data. A large portion of sign-ups took place in the first few days of the program, suggesting that there was a pent up demand for the do-not-call list. A spike occurs starting July 7, the first day that states east of the Mississippi could register using the toll-free number. Another spike can be found right before September 1, 2003. This one corresponds with the fact that sign-ups made prior to that day would be included when the list first went into effect on October 1, 2003 rather than waiting 90 days for numbers to be blocked. Several other smaller spikes occurring throughout the sample period come disproportionately from specific states. We use this correlation, along with independent information, to attribute each of 14 dates to the merger of a state list with the national list. More information on the individual statelists is available in Appendix A.
The DNC data are recorded by phone number but decisions to register are made by individuals, or more likely, by households. Since both individuals and households often have more than one phone number (multiple fixed lines and cellular phones), we examine both the number of households per county as well as an estimate of the number of fixed lines per county as the denominator to form sign-up frequencies.
Most of our demographic variables are extracted from the 2000 Census, including household income, size, race and composition as well as home value and mortgage. These data are supplemented with survey information from household-level panels run by the Census Bureau's Current Population Survey and TNS Telecom's ReQuest Survey dataset. Those panels are also rolled up to the county level to generate the average Internet usage and lines per household. We provide greater detail about the primary data sources and construction of variables in Appendix B.

5  Descriptive Statistics

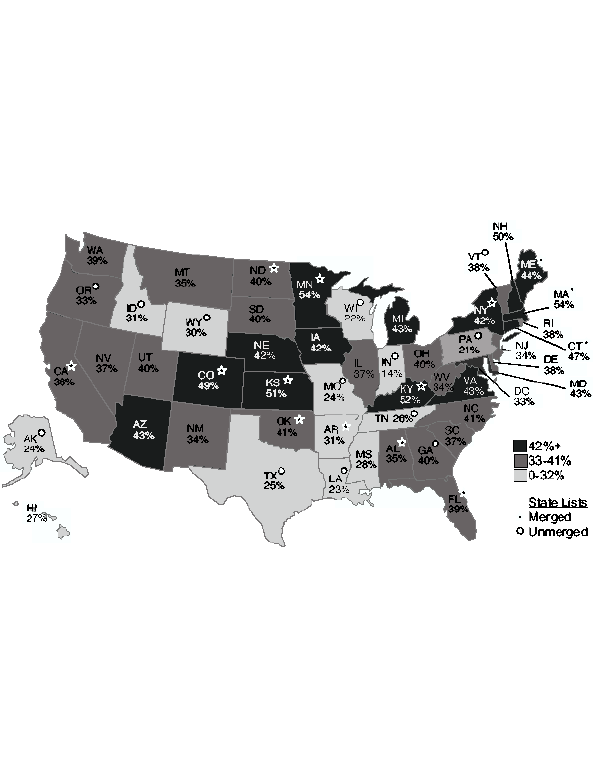
We begin by looking at the responses to the do-not-call list on a state by state basis. Figure 3 shows the proportion of households that has signed up for the FTC DNC list. The total sign-ups have been adjusted to exclude numbers on non-wired exchanges and to adjust for the average number of lines per household in each state. State specific do-not-call lists are identified in the figure as well as states that chose not to merge their lists.
graphics/DncByState.png
Figure 3: DNC registrations per household as of November 1, 2003.
As mentioned above, 31 states had some form of do-not-call registry, and 14 of those merged their lists with the national registry. Five of these 31 states simply used the Direct Marketing Association's TPS list which has a charge if registration was done on line. Additionally, six other state programs charged for their service. We find that charging for a do-not-call list depresses the frequency of sign-up. Of all the signups on the national list that occurred in our sample period, we attribute 11.8% to the merger of state lists. Looking just at state programs that were free, 14.3% of their signups came from state lists. Compare that with 7.2% for states that used the DMA's TSP, and also the mere 1.0% for those states that charged for signups.
Turning to our demographic variables and other explanatory factors, we include Table 1 below that contains the key explanatory variables that are used in the econometric analysis. For the complete set of summary statistics see Table 28 in Appendix C.
Table 1: Summary statistics for key variables
Variable Name Definition Mean Std. Dev.Min. Max.
... table 1 continued
Variable Mean Std. Dev.Min. Max.
Continued on next page...
pop No. people 90611.83 294411.59 444 9519338
hh No. households 33977.75 104956.02 185 3136279
Phone No. fixed lines 33130.09 102818.27 178 3079273
dncland Fixed line signups 15389.64 49257.26 16 1311045
pDNC Freq. of signups 0.39 0.19 0.00 2.09
HRaceWhite No. white HHs 26939.54 70845.25 122 1747061
HLatino No. Latino HHs 2959.83 24450 0 1012351
HHInc_Med Median HH income 35327.1 8826.86 15805 82929
EduLow Percent HHs with HS or less 0.13 0 .05 0 .02 0.33
HHLingIso No. HHs linguistically isolated 1407.37 11535.79 0 477729
OwnHome No. HHs own home 22471.88 59832.62 118 1499694
HasMortgage No. HHs have mortgage 12438.02 37999.45 8 1014178
HVal_Med Avg. home value 84046.12 46198.72 20100 1000001
HHPoverty No. HHs below poverty line 3998.77 13998.70 22 474533
UnmarriedPartners No. HHs with unmarried partners 1683.50 5686.34 0 181301
NoMale No. HHs with no male 9866.75 33204.13 36 950073
pInternet Percent HHs with Internet access 0.48 0.13 0 .04 0.87
N 3094

6  Demographics and Sign-up Frequencies

Our first goal is to describe the relationships between demographic categories and the observed frequencies of DNC sign-up. In this section we perform regression analysis of these relationships, examining one demographic variable at a time.
Using Census data, we determine the fraction of the households (or population) in each county that falls into a given demographic category. For example, in a particular county it may be that 96.3 percent of the households are White, 2.3 percent are Black, 0.006 percent are Asian, and so on. There is typically an "Other" category, so that the fractions generally sum to 1.
Suppose that in a given county i, si households sign up for the DNC list and that there are hi households in total and nig of those are classified in demographic group g=1,¼,G. We suppose that the demographic classification is complete so that åg=1G nig = hi.
Let us assume that a constant fraction ag of demographic group g signs up for the DNC list in every county. Then we can write
si=a1ni1+¼+aGniG.
or
fi= si

hi
=a1 ni1

hi
+¼+aG niG

hi
,
The fraction on the left is the frequency of DNC registration in a given country. The variables on the right are the fractions reported in the Census for each demographic group. Under the assumption of common sign-up frequencies of demographic groups across counties, we can estimate this relationship as a simple linear regression.
We interpret the coefficients ag as the average fraction of the particular demographic group that signs up for DNC. Under this interpretation, ag should always be between 0 and 1. In practice, the estimated coefficients do not always satisfy this requirement, since the model is not literally true: the fraction of sign-ups of a given group is not a constant, so there will typically be nonlinearities and cross-variable effects.
Nevertheless, it may be approximately true, and this way of summarizing the data appears to be useful and give intuitively plausible results about the marginal impact of demographic variables on frequency of sign-up. In cases where ai is greater than 1 or less than zero, we will simply indicate that the corresponding effect is "large" or "small."18
The coefficients in these regressions should not be interpreted as the incremental effect of one variable, holding everything else constant. Rather they should be interpreted in the sense of a marginal frequency distribution-how would we expect the frequency of sign-up to change when we move from a country with one distributions of races to another county with a different distribution of races, where other variables (income, housing, age, etc.) also change. These regressions are purely description in nature and should not be given a causal interpretation.
There is one final complication. In some cases the Census data reports the fraction of households; in other cases the Census data reports fraction of the population. Since we have the raw DNC sign-ups, we can divide by either number of households or the population, depending which normalization the Census report uses. The interpretation of the regressions coefficients will be different, depending on which normalization is used. In most cases the coefficient will represent fraction of households; in one (highest level of education attained by population 25 and older) it will represent a fraction of the population.
For example, Table 2 depicts the effect of race on the frequency of sign-up, where we have normalized by households. Roughly speaking, it appears that about 40% of Whites signed up, 15% of Blacks and low percentages of Native Americans, Pacific Islanders, and Others. However, a substantial percentage of Asians and Multirace households signed up. The column in the table labeled "Mean" indicates the fraction of the population represented by each demographic group.
Table 2: Race regression-Households
Variable Coefficient Std. Err. Mean
pHHRace_White 0.396**0.0040.870
pHHRace_Black 0.155**0.0190.077
pHHRace_Native -0.0660.0460.016
pHHRace_Asian 2.688**0.2180.006
pHHRace_PacIs -14.072**1.4220.000
pHHRace_Other -0.499**0.0790.018
pHHRace_Mult 2.125**0.3530.011
Significance levels :    f : 10%     * : 5%     ** : 1%
Table 3 shows the same regression with population used as the normalizing variable. The results are essentially consistent, reflecting the relative constancy of population per household: the mean is about 2.54, and half of the data lies between 2.48 and 2.71. So, for example, 2.6 times the coefficient on pRace_White in the population regression is .383, not terribly far from the . 396 in the household regression. The sign pattern and relative magnitudes of the coefficients are about the same, so to keep things consistent, we will report the data for the household normalization only in what follows.
Table 3: Race regression-Population
Variable Coefficient Std. Err. Mean
pRace_White 0.151**0.0020.845
pRace_Black 0.053**0.0070.087
pRace_Native -0.055**0.0160.018
pRace_Asian 0.649**0.0680.008
pRace_PacIs -4.456**0.4310.001
pRace_Oth -0.215**0.0250.025
pRace_Mult 1.182**0.1160.015
Significance levels :    f : 10%     * : 5%     ** : 1%
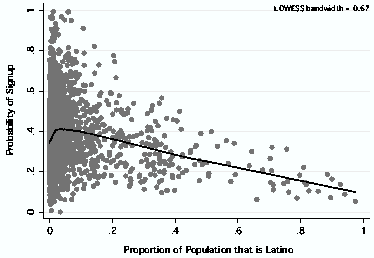
"Latino" is a separate classification from race and refers to country of origin. According to Table 4 they have a somewhat lower frequency of sign-up compared to non-Latinos. Figures 4 and 5 depict a simple scatterplot of the relationship between the frequency of sign-up for DNC and the fraction of the population that falls into the indicated groups. As can be seen, there is considerable variation across counties, but those with a high proportion of Blacks or Latinos definitely have a lower frequency of sign-up.
graphics/black.png
Figure 4: Frequency of sign-up versus fraction of population that is Black.
graphics/latino.png
Figure 5: Frequency of sign-up versus fraction of population that is Latino.
Table 4: Latino regression
Variable Coefficient Std. Err. Mean
pHHLatino 0.169**0.026 0.045
pHHLatinoNo 0.392**0.003 0.955
Difference -0.223**F(1,3092)=66.28
Significance levels :    f : 10%     * : 5%     ** : 1%
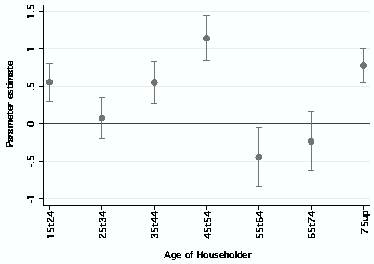
Age (of the householder), depicted in Table 5 and Figure 6, does not seem to have any consistent impact on the likelihood of signing up. It is worth noting that only 5 percent fall in the 15-24 category but the standard error is still low (and the estimate positive).
Table 5: Age regression
Variable Coefficient Std. Err. Mean
pAgeHH15t24 0.559**0.1270.048
pAgeHH25t34 0.0800.1350.145
pAgeHH35t44 0.554**0.1420.213
pAgeHH45t54 1.146**0.1530.198
pAgeHH55t64 -0.444*0.1980.147
pAgeHH65t74 -0.2320.1980.128
pAgeHH75up 0.780**0.1140.121
Significance levels :    f : 10%     * : 5%     ** : 1%
graphics/AgeReg.png
Figure 6: Age coefficients and standard errors.
Table 6 looks at the frequency of sign-up as a function of household size, with 2 and 4-person households having a high probability of signing up. Curiously households with 5 or more people seem to have a lower frequency of signing up. Perhaps larger households have a lower baseline level of privacy, so the incremental addition to overall privacy from DNC is low. Alternatively it may be the case that the annoyance of telemarketer's calls is spread over a larger number of people.
Table 6: Household size regression
Variable Coefficient Std. Err. Mean
pHHSize1 0.386**0.0720.253
pHHSize2 0.753**0.0650.347
pHHSize3 -1.454**0.1570.162
pHHSize4 3.285**0.2800.138
pHHSize5up -0.823**0.0960.238
Significance levels :    f : 10%     * : 5%     ** : 1%
Table 7 shows that households with young children are likely to sign-up and households with older children are unlikely to do so. The first could be attributed to the fact that someone is likely to be at home with the very young kids and the probability of being home when a telemarketer calls is thus higher.
Table 7: Kids regression
Variable Coefficient Std. Err. Mean
pKidsSub5 1.122**0.2040.147
pKids5t11 0.1260.1750.244
pKids12t18 0.765**0.1190.220
Significance levels :    f : 10%     * : 5%     ** : 1%
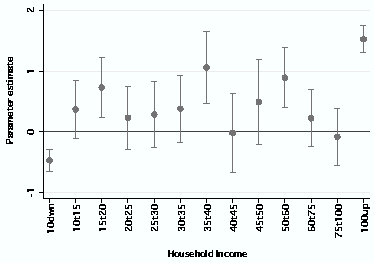
The effect of income on sign-up is shown in Table 8 and Figure 7. As one might expect, low income households have a low probability of sign-up. The frequency of sign-up generally rises with income, though the estimated coefficients are typically insignificant. However, households with incomes over $100,000 have a substantial likelihood of signing up.
Table 8: Household Income regression
Variable Coefficient Std. Err. Mean
pHHInc_10dwn -0.472**0.0930.121
pHHInc_10t15 0.3690.2420.081
pHHInc_15t20 0.732**0.2490.078
pHHInc_20t25 0.2300.2600.079
pHHInc_25t30 0.2830.2750.075
pHHInc_30t35 0.3790.2760.072
pHHInc_35t40 1.060**0.2990.065
pHHInc_40t45 -0.0230.3250.060
pHHInc_45t50 0.4910.3500.052
pHHInc_50t60 0.891**0.2510.088
pHHInc_60t75 0.2190.2350.090
pHHInc_75t100 -0.0850.2350.074
pHHInc_100up 1.528**0.1090.066
Significance levels :    f : 10%     * : 5%     ** : 1%
graphics/IncReg.png
Figure 7: Income coefficients and standard errors.
The impact of education is summarized in Table 9. Those with education of grade school or less have a low frequency of signing up, and high-school dropouts even more so. Those with a post-graduate education are quite likely to sign-up.19
Table 9: Education regression
Variable Coefficient Std. Err. Mean
pEduGrade 0.0870.0570.091
pEduSomeHS -0.191**0.0670.135
pEduHS 0.239**0.0310.348
pEduSomeColl 0.720**0.0460.262
pEduColl 0.414**0.1050.109
pEduPostGrad 1.506**0.1340.055
Significance levels :    f : 10%     * : 5%     ** : 1%
"Linguistic isolation," a census category referring to lack of English fluency measured at the household level, dramatically reduces the frequency of sign-up, as shown in Table 10.
Table 10: Household linguistic Isolation regression
Variable Coefficient Std. Err. Mean
pHHLingIso -0.206*0.093 0.017
pHHLingIsoNo 0.392**0.003 0.983
Difference -0.186**F(1,3092)=39.79
Significance levels :    f : 10%     * : 5%     ** : 1%
Table 11 indicates that those households with mortgages have a higher frequency of signing up, while Table 12 shows that sign-up frequencies tend to be low in areas where poverty rates are high.
Table 11: Mortgage regression
Variable Coefficient Std. Err. Mean
pHasMortgage 0.576**0.009 0.573
pHasMortgageNo 0.121**0.012 0.427
Difference 0.455**F(1,3092)=483.83
Significance levels :    f : 10%     * : 5%     ** : 1%
Table 12: Poverty regression
Variable Coefficient Std. Err. Mean
pHHPoverty -0.513**0.036 0.142
pHHPovertyNo 0.530**0.007 0.858
Difference -1.043**F(1,3092)=612.80
Significance levels :    f : 10%     * : 5%     ** : 1%
With respect to marital status, Tables 13 and 14 indicate that counties with a high fraction of unmarried partners have a much higher frequency of DNC registration than counties without, and that the presence of a male is correlated with an increased sign-up rate.
Table 13: Unmarried partners regression
Variable Coefficient Std. Err. Mean
pUnmarriedPartners 1.146**0.186 0.043
pUnmarriedNo 0.348**0.009 0.957
Difference 0.798**F(1,3092)=16.86
Significance levels :    f : 10%     * : 5%     ** : 1%
Table 14: Male adult present regression
Variable Coefficient Std. Err. Mean
pNoMale 0.216**0.043 0.261
pMale 0.441**0.015 7 0.739
Difference -0.225**F(1,3092)=15.07
Significance levels :    f : 10%     * : 5%     ** : 1%
We found in Table 15 that counties with a high fraction of Internet users tended to have higher sign-ups rates, but not by a dramatic amount.
Table 15: Internet regression
Variable Coefficient Std. Err. Mean
pInternet 0.431**0.012 0.486
pInternetNo 0.335**0.011 0.514
Difference 0.096**F(1,3092)=18.94
Significance levels :    f : 10%     * : 5%     ** : 1%
When looking at the relative urbanization of the counties we find that a higher degree of urbanization increases the likelihood of signing up for the DNC. Table 16 reveals that farming communities tend to have a higher sign-up than any other area.
Table 16: Urban/Rural regression
Variable Coefficient Std. Err. Mean
Urban 0.466**0.006 0.396
    Urban Area 0.492**0.008 0.164
    Urban Cluster 0.427**0.010 0.232
Rural 0.327**0.005 0.604
    Farm 0.611**0.070 0.040
    Non-Farm 0.315**0.007 0.564
Significance levels :    f : 10%     * : 5%     ** : 1%

7  A Grouped Logit Model of Sign-up Frequencies

Following the logic of the choice model described earlier, we specify a logistic regression model of the form

log æ
è
fi

1-fi
ö
ø
= b0 + b1 x1,i + ¼bk xk,i +ei
where fi is the sign-up frequency in county i and the xs are explanatory variables. The regression coefficients cannot easily be interpreted as structural demand parameters due to confounding with telemarketer behavior. Rather, this should be viewed as a nested specification. The models are estimated using weighted least squares with the weights proportional to 1/s2j where

s2i = 1

nifj(1-fi)
and ni is the number of households in county i.
Table 17 provides the regression results for a number of different model specifications. We report odds ratios (eb) rather than b. Standard errors and t-tests are similarly transformed.20
Table 17: Full model grouped logit results, odds ratios
(1) (2) (3) (4) (5) (6) (7) (8)
Kitchen Sink Parsimonius I Parsimonius II State Level
lHHInc_Med 4.103**2.634**3.053**2.772**2.127**2.028**
[0.621] [0.378] [0.147] [0.139] [0.088] [0.091]
pHHPoverty 6.619**1.53
[4.040] [0.809]
pInternet 1.214*0.982
[0.119] [0.087]
pHHRace: White 1.997f8.451**
[0.765] [3.028]
pHHRace: Black 1.306 5.946**
[0.515] [2.276]
pHHRace: Native 1.025 3.681**
[0.548] [1.824]
pHHRace: Asian 0.255*2.969f
[0.156] [1.740]
pHHLatino 1.793**2.017**3.300**2.759**
[0.381] [0.430] [0.465] [0.412]
pHHSize2 19.439**0.117**
[16.268] [0.091]
pHHSize3 0.010**0.001**
[0.012] [0.001]
pHHSize4 0.018*0.002**
[0.030] [0.004]
pHHSize5up 149.270**21.528**
[157.042] [20.096]
pKidsSub5 12.596**5.784*
[11.353] [4.535]
pKids5t11 0.097**0.300f
[0.080] [0.214]
pKids12t18 0.011**0.050**0.078**0.084**0.198**0.258**
[0.007] [0.030] [0.017] [0.018] [0.040] [0.051]
pAgeHH25t34 3.225 0.072**
[3.117] [0.061]
pAgeHH35t44 4.746f0.366
[4.363] [0.290]
pAgeHH45t54 24.363**1.234
[22.083] [1.018]
pAgeHH55t64 2.908 1.849
[3.279] [1.787]
pAgeHH65t74 0.629 0.463
[0.735] [0.475]
pAgeHH75up 0.557 0.623
[0.474] [0.466]
pHHLingIso 0.020**0.045**0.006**0.011**
[0.010] [0.024] [0.002] [0.004]
pNoMale 2.452 0.157**
[1.628] [0.094]
lHVal: Med 0.852**0.918*
[0.034] [0.036]
pHasMortgage 1.237 2.540**
[0.258] [0.532]
pEduLow 0.208**0.079**0.091**0.035**0.007**0.002**
[0.123] [0.044] [0.032] [0.013] [0.002] [0.001]
pUnmarriedPartners 0.013**2.308
[0.013] [2.601]
HasList 0.533**0.489**0.546**0.441**0.554**0.363**0.492**0.502**
[0.011] [0.089] [0.010] [0.080] [0.011] [0.068] [0.012] [0.124]
MergeList 2.391**2.723**2.287**2.928**2.148**3.021**2.254**2.284**
[0.054] [0.431] [0.045] [0.463] [0.042] [0.490] [0.055] [0.500]
pUrban: Area 3.905*9.717**
[2.368] [5.415]
pUrban: Cluster 4.551*10.321**
[2.781] [5.774]
pRural: Non-Farm 3.904*8.418**
[2.464] [4.896]
Observations 3094 3094 3094 3094 3094 3094 3094 3094
Adjusted R2 0.61 0.75 0.58 0.72 0.55 0.70 0.28 0.45
Standard errors in brackets
Significance levels :    f : 10%     * : 5%     ** : 1%
The probability of signing up for the FTC DNC list is larger in counties comprised of households with higher incomes. Not surprisingly, low education (i.e. never finished high-school) and household linguistic isolation have negative impacts on registration. It is harder to explain the consistent positive impact by a high proportion of Latino households in the county and the negative impact of teenagers. Unexpectedly, once we control for these other variables, Internet penetration does not make much of a difference on DNC sign-ups.
Perhaps the most interesting result is how much explanatory power can be derived from only three variables: Income, Teenagers and Low Education. Compared to Models 7 and 8 that only use state level variables, these three variables raise the adjusted R2 by 27% and 25% for the models without and with state dummies, respectively. Even throwing in the full kitchen sink contributes only an additional 5-6%.
The Census reports household income in bins as well as a median. For these models we have chosen to use the median since this allows us to construct an imperfect measure of income elasticity from the grouped logit results. Our estimates are evaluated at median national household income and given in Table 18 for each of the six grouped logit specifications. All estimates are positive with very small standard errors, and indicate rather income inelastic demand for DNC protection.21
Table 18: Income Elasticities for Grouped Logit Models
Model Elasticity Std. Err. P > |z|
(1) Kitchen Sink 0.880 0.094 0.000
(2) Kitchen Sink, SD 0.604 0.089 0.000
(3) Parsimonius I 0.694 0.031 0.000
(4) Parsimonius I, SD 0.632 0.032 0.000
(5) Parsimonius II 0.473 0.027 0.000
(6) Parsimonius II, SD 0.441 0.028 0.000
Elasticities Calculated at the Median Income: $35,348

8  Demand for a Do-Not-Spam List

Considerable pressure has been brought to bear on the federal government to "do something" about spam email. Government regulators have been resisting any action, many of whom feel that enforcement of a do-not-spam law is futile. Nevertheless, it is worth while to speculate about how many sign-ups a do-not-spam list might elicit based on our results for do-not-call.
We begin by making the bold assumption that the propensity to sign up for a do-not-call list is a good approximation for the propensity to sign up for a do-not-spam (DNS) list. Of course, only that subset of the population having Internet access-or more specifically, using email-are candidates for a DNS list. To estimate the proportion of this population that would register, we simply multiply by the observed (marginal) frequency of DNC registrations. This calculation is accurate provided sign-up for the DNC list and subscription to Internet access are roughly independent variates for U.S. households. In fact, we find these two variables to be nearly orthogonal, approaching this relationship from two distinct directions.
The Pew Foundation has sponsored a series of telephone surveys regarding Internet use.22 A June 2003 Pew telephone survey asked 2,200 Americans several questions about their attitudes towards spam and telemarketing. Table 19 indicates how annoying spam and telemarketing were perceived to be. (In these tables "DK" is "don't know" and "NA" is "not applicable.")
Table 19: How much annoyance comes from ...
Type DK NA None Small Big Very big
Telemarketing 25 40 152 275 755 953
Email spam 2 847 86 205 509 661
Surprisingly, roughly 20 percent of respondents indicated that telemarketing and spam caused "no" or "small" annoyance. (On the other hand, spam has gotten increasingly more prevalent in the time since the June 2003 Pew survey.) Looking at the cross tabulation in Table 20, it is clear to the naked eye that the same people who were not bothered by either spam or telemarketing. A Chi-squared test rejects non-independence at a very high level of significance.
Table 20: Spam and telemarketing responses
Telemarketing
Spam DK NA None Small Big Very big
DK 1 0 0 0 1 0
DNA 22 28 87 98 259 353
None 0 1 23 13 17 32
Small 0 0 7 64 69 65
Big 1 6 12 64 257 169
Very 1 5 23 36 152 334
This suggests that pretty much the same fraction of households who signed up for the do-not-call list would sign up for a do-not-spam list given that they are Internet users. This conclusion is confirmed by both our simple demographic model reported in Table 15 and the results reported in Table 17. Columns (1) and (2) in those two tables indicate that Internet usage and DNC registrations nearly orthogonal. A simple correlation calculation between pInternet (the probability of having and using Internet access at home) and pdncland (the probability of a household signing up for the DNC list) is a mere 0.078.23
To further examine the relationship between Internet usage and DNC registration we take advantage of an (unintentional) design feature of the FTC's implementation. As described above, only Internet sign-up was possible for users east of the Mississippi during the first 10 days of the program, whereas those west of the Mississippi could sign-up using a toll-free phone number as well. We extend model 4 from Table 17 with a geographical dummy to divide the country at the Mississippi and run the regression interacting the east/west dummy with Internet usage.24
Table 21: DNC grouped logit regression on signups before and after July 7 and separated by states east and west of the Mississippi. Odds ratios.
(1) (2) (3) (4)
Week 1 Week 2-
pInternet 1.0261.0260.656**0.617**
[0.064] [0.064] [0.054] [0.062]
east 1.345*0.793 1.424*
[0.175] [0.114] [0.231]
east*pInternet 2.069**1.215f
[0.185] [0.132]
Controls yes yes yes yes
Observations 3094 3094 3094 3094
Adjusted R2 0.79 0.79 0.79 0.80
Significance levels :    f : 10%     * : 5%     ** : 1%
Controls: lHHInc_Med, pHHLatino, pKids12t18,
pHHLingIso, p_EduLow, HasList,
MergeList and state dummies
Columns (1)-(3) report the results of the grouped logit model on sign-ups during the period June 27, 2003 through July 6, 2003. It is important to note that the base effect of the Internet is negative (just as in the main model) but that it is significant and positive for counties east of the Mississippi. The latter is no surprise since the Internet was the only way to sign up during that period, the restriction limited the sign-ups or at least forcing the mode of sign-up. Column (4) contains the equivalent grouped logit for the subsequent period July 7-November 1, 2003. The estimate for sign-ups in the east, east, is significantly larger in (4) than in (3), thus not having access to a toll-free number the first week caused a catch up effect in the next period.
Although there may be a statistically significant and positive relationship between the sign-up for the FTC DNC list and household Internet usage, we believe it is economically defensible to assume orthogonality given the results reported in this section. Thus, a rough forecast of the number of sign-ups for a do-not-spam list would be the number of those who signed up for do-not-call, adjusted for the fraction of the population that has Internet access.
This is easily computed from the data we have available. At the aggregate level, about 47 million households signed up for DNC (45 percent of the total), and about 54 percent of the households in our sample had Internet access (as of the 2000 Census.) So our (very rough) forecast would be that about 25% of U.S. households would sign up for a do-not-spam list.

9  Value of the DNC list

One could estimate the value of the DNC list in a variety of ways. According to the FTC, prior to the its do-not-call registry, about 104 million telemarketing calls were attempted per day.25 If each of these calls imposed, say, a net 10 cents worth of annoyance on the recipients, then this amounts to $10 million per day, or about $3.6 billion per year of annoyance.
Alternatively, one could argue that consumers could get themselves removed from most lists by sending a postcard to the DMA or registering on the DMA website for $5 per year, or by signing up on a state DNC list. Most state lists, the DMA list and the national DNC list are valid for 5 years. In that case the 7.5 million people registered on the DMA's list would cost consumers a maximum of $7.5 million if each were to pay $5 for 5 years on the list, or $1 per year. About 48 million more people signed up on the national DNC list, which was free. If we assume that people were aware of their options prior to the FTC's DNC list-a heroic assumption to be sure-those additional 48 million people presumably valued the freedom from being called at something less than $1 per year. This would put an upper bound on the extra value of the DNC list at $48 million per year.
To be sure, there is an enormous gap between $48 million and $3.6 billion. However, even the lower number indicates that the national do-not-call list has generated significant consumer benefits.

A  State List Details

Even before the introduction of the FTC DNC list, 27 states had their own DNC list. Table 22 shows a summary of the individual state lists in use by July 1, 2003. 26 The start date generally reflects when the list went live, but when that information wasn't clearly available the date reflects when the legislation was enacted. Merged indicates the imputed date that the state list was merged with the FTC list (blank means it was not merged). DMA/TPS refers to the states promting signup for the Direct Marketing Association's Telephone Preference Service. The cost of signing up is there as an indication only since the terms vary greatly. Signing up for the TPS list is free via mail, but a $5 charge is put on signups through the web.
Table 22: States with their own DNC lists.
State Start Merged DMA/TPS Fee
Alabama 6/29/00 20/8 free
Alaska Nov'96 $5-$50
Arkansas Jan'00 21/8 $5/year
California 4/1/03 26/7 free
Colorado 7/1/02 28/7 free
Connecticut 1/1/01 22/8 free
Florida Q2'999/8 $10/$5
Georgia Jan'99 $5
Idaho Jan'01 $10/$5
Indiana 1/1/02 free
Kansas 1/1/03 18/8 free
Kentucky 7/15/02 17/8 free
Louisiana 1/1/02 free
Maine 2003? 26/7 free
Aug'01 Yes $$5 online
Massachusetts 1/1/03 15/8 free
Minnesota 1/1/0320/8 free
Missouri 7/1/01 free
New York 4/1/01 14/8 free
North Dakota 4/1/03? 9/8 free
Oklahoma 1/1/03 22/7 free
Oregon Jan'00 $6.50/$3
Pennsylvania 4/2/02Yes$5 online
Tennessee 7/1/00 free
Texas 1/1/02 $2.25/number
Vermont 7/1/02 Yes$5 online
Wisconsin 1/1/03 free
Wyoming Jul'01 Yes $5 online
Several of the most recent lists seems to have been enacted to support the FTC Do-Not-Call list. In effect these lists had as their main purpose to allow citizens to pre-register for the FTC list. California is definitely in this category, but it is likely the case for most lists added during 2003. Maine has been using the TPS list since 2001, but, as far as we can tell, they started taking pre-registrations for the FTC DNC list as well hence the two rows entries.
Table 23: Proportion of households signed up to merged state lists.
Cost of Signing up
Start Year Free Fee TPS Total
2003 12.5% (7) . . 12.5% (7)
2002 33.6% (2) . . 33.6% (2)
2001 14.1% (1) . 7.2% (1) 13.8% (2)
Earlier 1.1% (1) 1.0% (2) . 1.0% (3)
Total 14.3% (11) 1.0% (2) 7.2% (1) 11.8% (14)
Number of observations (states) in parenthesis.
Table 23 summarizes the imputed size of the state lists that were merged with the national DNC list. The date of the merger is identified visually and the mean daily signup rate between July 10 and August 28, not including the day of the merger, is used as the baseline. The resulting number is then deflated by the average number of phone lines in the state and compared to the total number of households.

B  Data Collection and Variable Construction

We use information provided by the Melissa Data Corporation (www.melissadata.com) to map phone exchanges into counties. Their "Telephone Database" also identifies exchanges that are associated with wireless services (e.g., cellular phones, beepers). Recently, the North American Numbering Plan was extended to include "thousand block number allocation" which made distinct assignments of each of the ten blocks of one thousand possible numbers in an NPA-NXX group. As a result, some of the thousand blocks could be assigned to wireless services while others are assigned to fixed line services. Our procedure for removing wireless numbers ignores this possibility.
Table 24: Distribution of exchanges represented in the DNC list.
Wired 92,695 72.1%
Wireless 35,841 27.9%
Total 128,536 100%
Collapsing the DNC phone numbers by county provides us with 3,185 observations (out of approximately 3,200 counties). Table 25 shows the distribution between wired and wireless DNC sign-ups based on the mapping from the Melissa Data.
Table 25: Distribution of DNC signups for wired and wireless exchanges. Aggregated by county.
N mean sum
Wired 3,185 15,123 48,165,480 82.4%
Wireless 3,185 3,232 10,294,702 17.6%
Total 3,185 18,355 58,460,182 100%
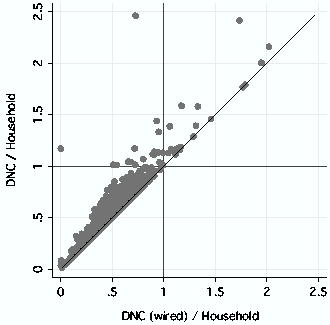
To form the DNC sign-up frequencies, we divide sign-ups by two denominators both taken from Census: the number of households in the county and the number of households with a fixed line. Figure 8 compares the proportion of total DNC signups to total number of households (per county) v. signups of fixed telephony numbers to households with a phone. There are a number of counties where the ratio of cellphone to landline DNC registrations are surprisingly high (as much as 33 times higher in one county). It is possible that this points to errors in the classification between fixed and wireless exchanges in the Melissa Data. There are also a number of counties where the signup rate is above 1 (37 and 17 for all and wired respectively). One obvious reason for this is that we have not corrected for the number of lines per household (and thus multiple signups per household). Correcting the signup on landlines for number or lines leaves us with 9 counties out of 3,113 that have signup rates in excess of 1.27
graphics/dncHHvPhone.png
Figure 8: Plot of Total DNC Sign-ups per Household vs. Sign-ups of Land-lines per Household
We next use a telecommunications consumer survey provided by Taylor, Nelson, Sofres, the international market research firm. This survey is conducted by the TNS Telecoms division in cooperation with National Family Opinion's national consumer panel. Data are collected quarterly on household purchases of many kinds of communications services and equipment, other household purchase decisions and attitudes, and detailed demographic characteristics. Each quarter has approximately 25,000 respondents. We draw on 10 quarters of the TNS Telecoms survey beginning in 3Q1999 and running through 4Q2000. This provides us with 256,312 observations for 49 states (including DC but excluding Alaska and Hawaii) and covers 3,024 counties.
We use these data to estimate the average number of fixed phone lines per household in each county as well as estimating Internet usage. For the represented counties, the minimum number of observations is 1 and the maximum 5,582 with a mean of 724.9 households per county. The mean Internet usage across these counties is 50.3% which is close to independent estimates of nationwide Internet use during the 1999-2001 time frame.
The TNST dataset also provide us with a count of fixed lines per household (set Table 26). On a state level we have number of lines per household ranging from 1.2 to 1.5 (mean of 1.22 and standard deviation 0.08). This figure is very close to the recently reported average of 1.24 fixed lines per household estimated by the FCC. Since the dataset did not include an observations from either Alaska or Hawaii we assigned them the mean of 1.22. In the end these data are only used in descriptive statistics (see, for example, Figure 3).28
Table 26: Number of fixed telephone lines per household. Source: TNST
# Lines Frequency Percent
0 6,872 2.7%
1 198,995 77.6%
2 42,579 16.6%
3 6,011 2.4%
4 1,855 0.7%
Total 256,312 100%
Mean 1.241
Std. Dev. 0.525
We complement the TNST estimate of Internet usage with data drawn from the Current Population Survey, August 2000-Internet and Computer Use Supplement.29 The CPS  is based on 134,986 responses to a survey, of which 70,413 responded to the question "Does anyone in this household use the Internet from home?" In this subsample, 79.9% of which answered affirmative. We are assuming that the CPS sample is essentially independent of the households sampled in the TNST data and aggregate the two datasets for our base Internet usage statistic by county.
After aggregation we are still left with a significant number of counties with no or very few observations. We assign the state average Internet usage to these counties. Rather than using a cutoff based on the number of observations alone, we looked at the difference between the county mean and the state-wide average divided by number of observations. If the difference was more than 2 percentage points, we replaced the county mean with the state mean. The breakdown can be seen in Table 27.
Table 27: Counties with measured vs. assumed Internet usage. Source: CPS, TNST
Counties
Total Counties 3,200
Cty Mean Used 2,211
Imputed 989
No State Mean 72
No County Mean 102
Diff > 0.02 815
We turn to the 2000 U.S. Census as the source for our household demographics.30 In particular, Summary File 3 (SF3) reports 813 detailed tables of social, economic and housing characteristics compiled from a sample of approximately 19 million housing units (about 1 in 6 households) that received the Census 2000 long-form questionnaire.31 We use these data aggregated at the county (i.e., five-digit FIPS code) level.
Apart from demographics, we also use the SF3 Census data for the denominator in estimating DNC sign-up frequencies. In all of our models we use the number of occupied households per county. When we restrict ourselves to sign-ups of phone numbers corresponding to wired exchanges, we use households with a fixed telephone line as the denominator.

C  Summary Statistics

This section contains summary statistics for the count variables by county. The non-count variables (including HasList, MergeList, pInternet, and pEduLow) are reported as proportions. Variables that are county-level statistics such as HHSize_Avg, HHInc_Med and HVal_Med are reported as average or median values.
Table 28: Summary statistics for selected demographic count variables
Variable Mean Std. Dev.Min. Max.
... table 28 continued
Variable Mean Std. Dev.Min. Max.
Continued on next page...
pop 90611.83 294411.59 444 9519338
hh 33977.75 104956.02 185 3136279
Phone 33130.09 102818.27 178 3079273
dncland 15389.64 49257.26 16 1311045
pInternet 0.48 0.13 0.04 0.87
HasList 0.62 0.49 0 1
MergeList 0.28 0.45 0 1
HRaceWhite 26939.54 70845.25 122 1747061
HRaceBlack 3863.30 18913.14 0 475175
HRaceNative 246.45 920.52 0 19922
HRaceAsian 1005.60 8994 0 362618
HRacePacIs 31.81 412.81 0 19785
HRaceOther 1237.06 11256.51 0 517748
HRaceMult 635.00 3539.12 0 138223
HLatino 2959.83 24450 0 1012351
AgeHH15t24 1750.02 5290.89 0 142220
AgeHH25t34 5840.51 20475.32 19 637236
AgeHH35t44 7814.17 25495.82 35 798701
AgeHH45t54 6826.14 20967.08 28 627511
AgeHH55t64 4571.97 13366.18 23 387127
AgeHH65t74 3741.58 10544.55 15 287089
AgeHH75t84 2651.06 7641.93 5 198907
AgeHH85up 782.30 2292.98 0 57488
HHSize_Avg 2.54 0.20 2 4.38
HHSize=1 8757.93 28161.87 41 770739
HHSize=2 11027.72 30604.21 75 814159
HHSize=3 5595.08 16777.51 22 490854
HHSize=4 4842.53 15062.83 14 467485
HHSize=5up 8597.02 30596.16 32 1060527
KidsSub5 5331.30 17909.99 12 587541
Kids5t11 8491.63 28624.48 38 975043
Kids12t18 6967.22 21650.59 40 701013
HHInc_Med 35327.1 8826.86 15805 82929
HHInc_10dwn 3245.14 10596.3 18 330000
HHInc_10t15 2145.21 6262.76 9 203819
HHInc_15t20 2126.87 6138.90 13 196731
HHInc_20t25 2234.22 6466.66 21 201561
HHInc_25t30 2190.16 6340.11 14 191887
HHInc_30t35 2163.32 6342.13 10 189179
HHInc_35t40 2007.86 5854.35 4 169484
HHInc_40t45 1920.62 5617.22 2 162317
HHInc_45t50 1688 4914.53 4 140505
HHInc_50t60 3069.17 9068.30 10 253707
HHInc_60t75 3540.26 10980.77 6 304843
HHInc_75t100 3473.71 11694.38 3 318521
HHInc_100up 4173.21 17217.86 3 473725
EduGrade 4435.41 22066.65 4 955932
EduSomeHS 7076.45 24050.12 11 814592
EduHS 16801.11 43127.85 98 1108314
EduSomeColl 16049.22 51059.14 96 1541721
EduColl 9107.99 33242.33 35 945634
EduPostGrad 5194.11 19901.85 3 516755
pEduLow 0.12 0.05 0.02 0.33
HHLingIso 1407.37 11535.79 0 477729
OwnHome 22471.88 59832.62 118 1499694
HasMortgage 12438.02 37999.45 8 1014178
HVal_Med 84046.12 46198.72 20100 1000001
HHPoverty 3998.77 13998.70 22 474533
UnmarriedPartners 1683.50 5686.34 0 181301
NoMale 9866.75 33204.13 36 950073
Urban_Area 24887.42 109647.73 0 3235535
Urban_Cluster 4080.08 6041.91 0 78099
Rural_Farm 356.87 306.15 0 4676
Rural_NonFarm 7984.13 7021.11 0 52776
N 3094

Footnotes:

1 Research support from NSF grant 9979852 is gratefully acknowledged. We would also like to thank the Federal Trade Commission for providing a redacted version of is do-not-call registry, to TNS Telecoms for use of its ReQuest Market Monitor database, and to UC Data for help and advice with Census data. The authors can be contacted at [hal,fredrik]@sims.berkeley.edu, glenn@econ.berkeley.edu.
2Two other types of privacy include "anonymity" and "secrecy." See Ruth Gavison, "Privacy and the Limits of Law," Yale Law Journal, vol. 89, 1980, pp. 421-471.
3 47 C.F.R. 64.1200 (June 26, 2003). The FTC's rules were spelled out with amendments to its Telemarketing Sales Rule, 67 FR 4492 (Jan. 30, 2002).
4 Web-based sign-ups ran into some problems, as when the consumer did not receive the verification email possibly because it was screened by their spam filter, or they could not verify registration by clicking on the provided link due to an out-of-date browser.
5 Cell phones are a rare target for telemarketers because the TCPA bans the use of auto dialers to call cell phones, or leaving any prerecorded message of any kind. The only alternative is a hand-dialed call from a live person-an expensive option.
6From an FTC news flash June 2003: http://www.ftc.gov/ocr/ftcv2n6.htm
7 Beginning on January 29, 2004, the FTC also required telemarketers to display their name and number on caller ID devices.
8Any phone number registered directly to the FTC list must also be transferred to the corresponding state DNC list when one exists.
9 Registration with TPS is free by mail and costs $5 for online sign-up. The sign-up page is at http://www.dmaconsumers.org/cgi/offtelephonedave.
10 http://www.the-dma.org/cgi/dispnewsstand?article=921++++++. We cannot be certain exactly what this figure means.
11There is some evidence that many consumers believe that having their phone numbers non-listed with directory assistance or not published in the white pages will reduce their telemarketing calls. Since telemarketers rely more on purchased lists that are drawn from other sources, the benefit to these consumers is likely to be negligible.
12In fact, consumers can selectively accept calls from a particular telemarketer under the FTC DNC program, but only by making a specific request in writing.
13In fact, many telemarketers use random number dialing. Since the average exchange utilization is about 50%, dialing a random number in an exchange has about a 50% chance of finding a working telephone. However, the choice of which exchanges to mine is influenced by the demographic makeup of the exchange and there are several services that supply the telemarketing industry with demographic information by telephone exchange (one of which we used for this study.)
14It is possible that having a larger household with more people answering the phone also reduces the annoyance by distributing it over multiple people, specifically shielding the household decision makers.
15Indeed, some telemarketers recognize the benefits in do-not-call programs as they weed out households who are annoyed by calls and would not make a purchase anyway. See Robert Gutsche Jr., "Telemarketing firms face their toughest call: Costs of new rules push many companies to brink," Chicago Tribune, February 25, 2004.
16Express the probability that a telemarketer will call household n as follows:
pn = Pr{pn > 0} = Pr{nn > c-qntn} = 1-G(c-qntn),
where G(·) is the conditional c.d.f. of the profitability disturbance.     Then substitute into the household choice probability to get:
fn=1-F{ [ 1-G(c-qntn)] an-byci}
Differentiating with respect to income yn we get that:
fn/yn=- é
ë
g æ
è
qn

yn
tn+qn tn

yn
ö
ø
an+(1-G) an

yn
ù
û
which cannot be signed without further assumptions on the signs of the various income effects.
17 In fact, the Census data is collected in "bins" although they report median incomes as well as frequencies by bin.
18We also estimated the regressions constraining ai to lie between 0 and 1 and found that the results were essentially what one would get by just truncating the coefficient. That is, there was generally no impact on the other coefficients from forcing coefficients to lie in the 0-1 interval. For this reason we report the unconstrained regressions.
19 In later models we merge the first two categories into a new "low education" variable.
20Odds ratios measure the impact of the variable on the relative odds of signing up for the DNC list. No effect is measured by an odds ratio of 1.
21The calculated elasticities are for the probability of sign-up over median income, [(log(pdncland))/(lHHInc_Med))]
22Survey results along with the raw data are available at http://www.pewinternet.org/datasets/index.asp.
23Significant at the 0.01% level.
24Our predicted Internet usage is not significantly different between the two halves of the country: 51.6% in the west and 47.2% in the east, not statistically significant.
25Notice of Proposed Rulemaking and Memorandum Opinion and Order, dated September 18, 2002, pp. 6-7.
26The information was compiled by looking at webpages and press releases regarding each list. A good starting point is http://www.the-dma.org/government/donotcalllists.shtml
27Due to the limited number of observations on number of lines we are using state means which may be enough to explain these last oddities.
28We would like to include lines per household in our DNC estimations as an adjustment but are concerned with the lack of observations.
29http://www.nber.org/cps/cpsaug00.pdf
30We used the data prepared by ICPSR available at: http://webapp.icpsr.umich.edu/cocoon/CENSUS-STUDY/13402.xml.
31http://www.census.gov/Press-Release/www/2002/sumfile3.html


File translated from TEX by TTH, version 3.59.
On 3 May 2004, 19:54.